Node.js lambda
- 17 May 2024
- 4 Minutes to read
- PDF
Node.js lambda
- Updated on 17 May 2024
- 4 Minutes to read
- PDF
Article Summary
Share feedback
Thanks for sharing your feedback!
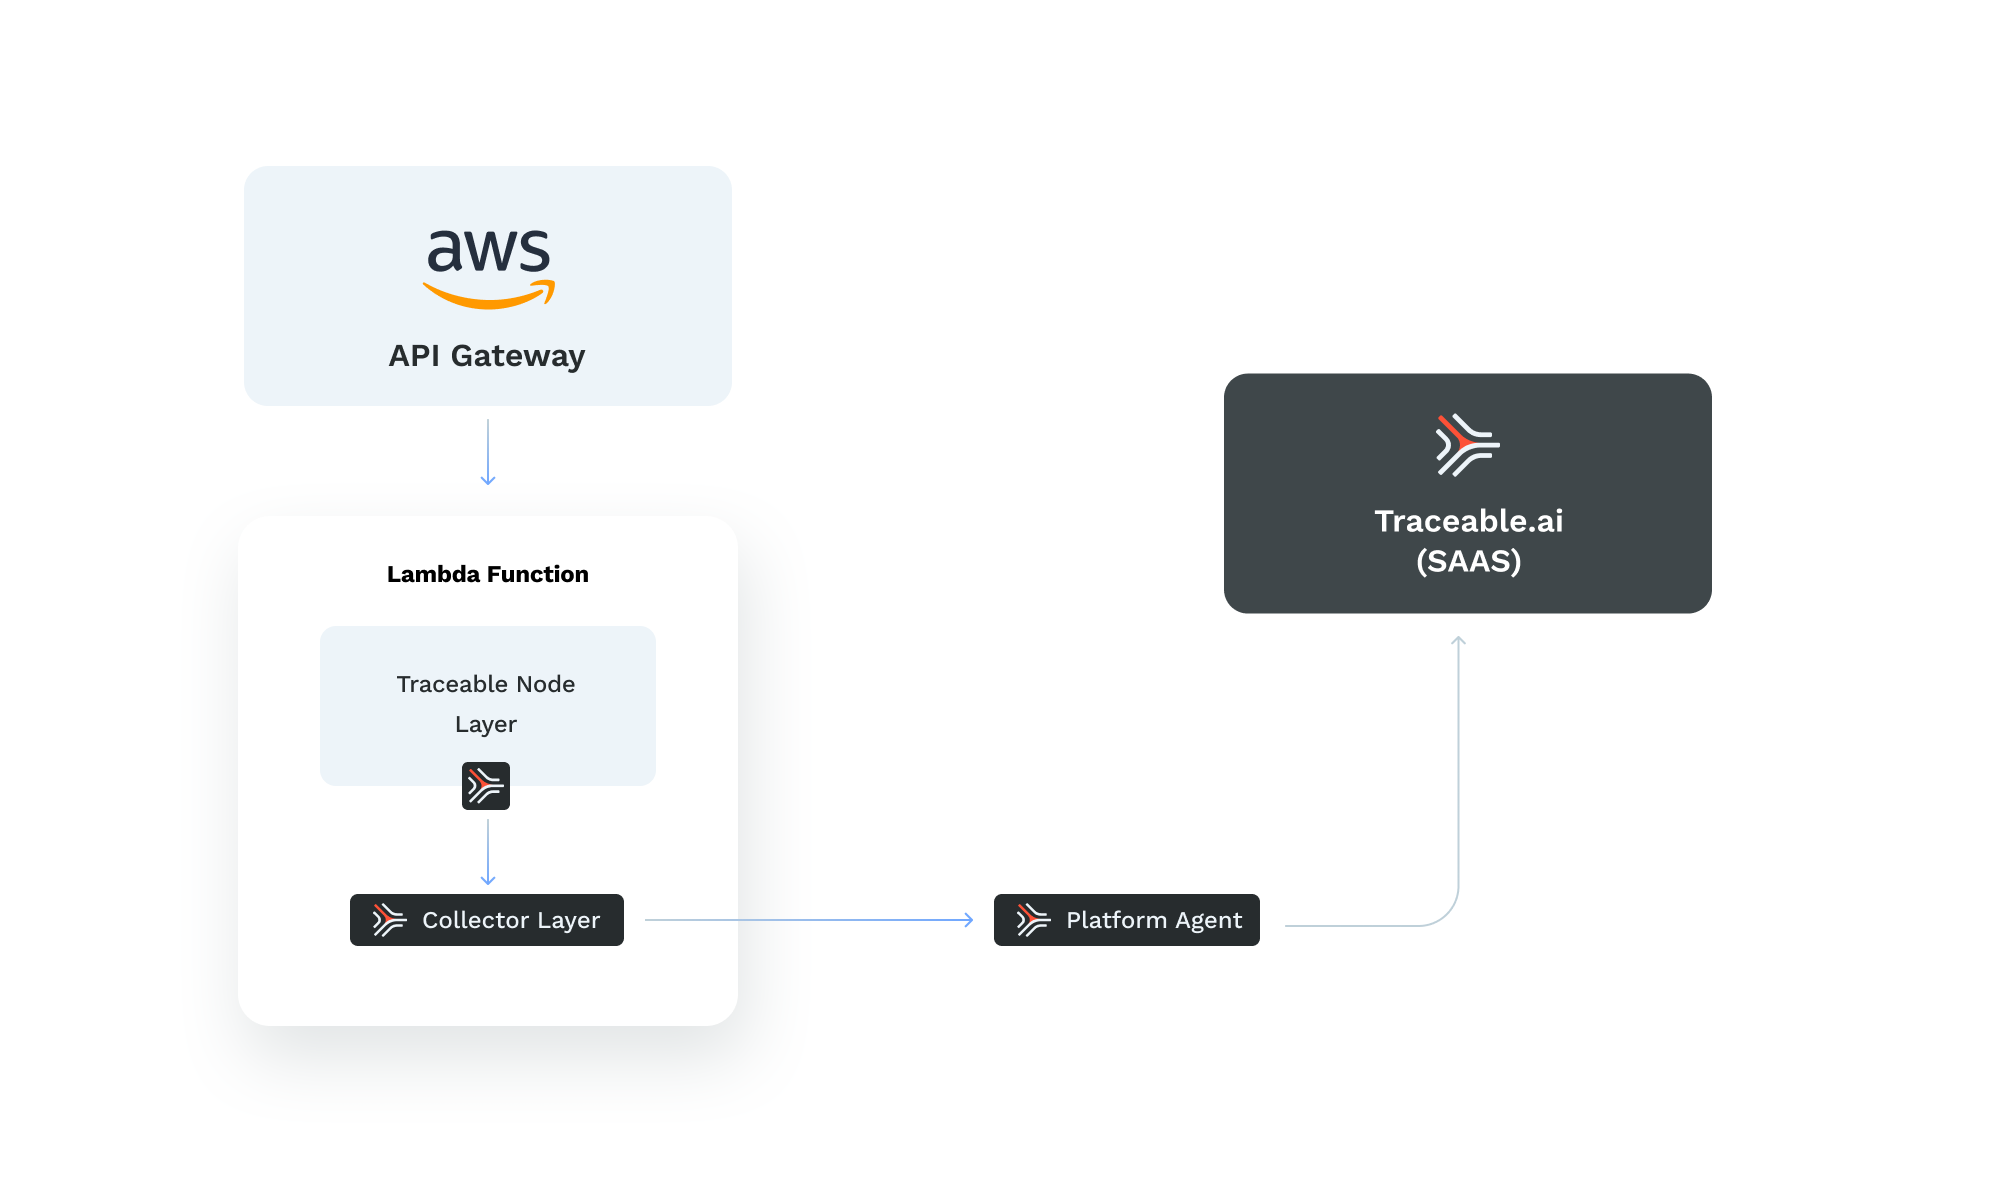
If your application uses Node.js lambdas, Traceable provides a tracing agent. Configuring Traceable for your application using Node.js lambdas consists of deploying a lambda, adding the Traceable Node.js and Traceable collector layers, and configuring the Traceable Node.js and Traceable collector layers. The following diagram shows a high-level deployment architecture for Traceable's Node.js lambda.
Deploy a lambda
Add the Traceable node and Traceable collector layers
Configure Traceable node and Traceable collector layers
Before you begin
Make a note of the following points before you begin installation and configuration:
You must have installed and configured the Traceable Platform agent. For more information, see Platform agent.
Make sure that port number 4318 is available for the lambda function.
Note the Traceable Platform agent IP address. It will be used in step 3 during layer configuration.
Make sure that you have an AWS account.
Step 1 – Deploy a lambda
To deploy a lambda, first find or create a lambda for Node.js 10.x, 12.x, or 14.x. The lambda must have an API gateway as the frontend.
Note
The lambda must be using x86_64 architecture. Arm64 is currently not supported.
Step 2 – Add the layers
As part of adding layers, you need to add two layers to the Lambda.
Layer 1 –
traceableai-nodejs- This layer works for any version of Node.js supported in Lambda 10.x, 12.x, and 14.x.Layer 2 –
traceableai-collectorLayer
Latest Layer Version
Node.js
16
Collector
6
In Lambda UI, when you add a layer, select Specify an ARN as shown below:
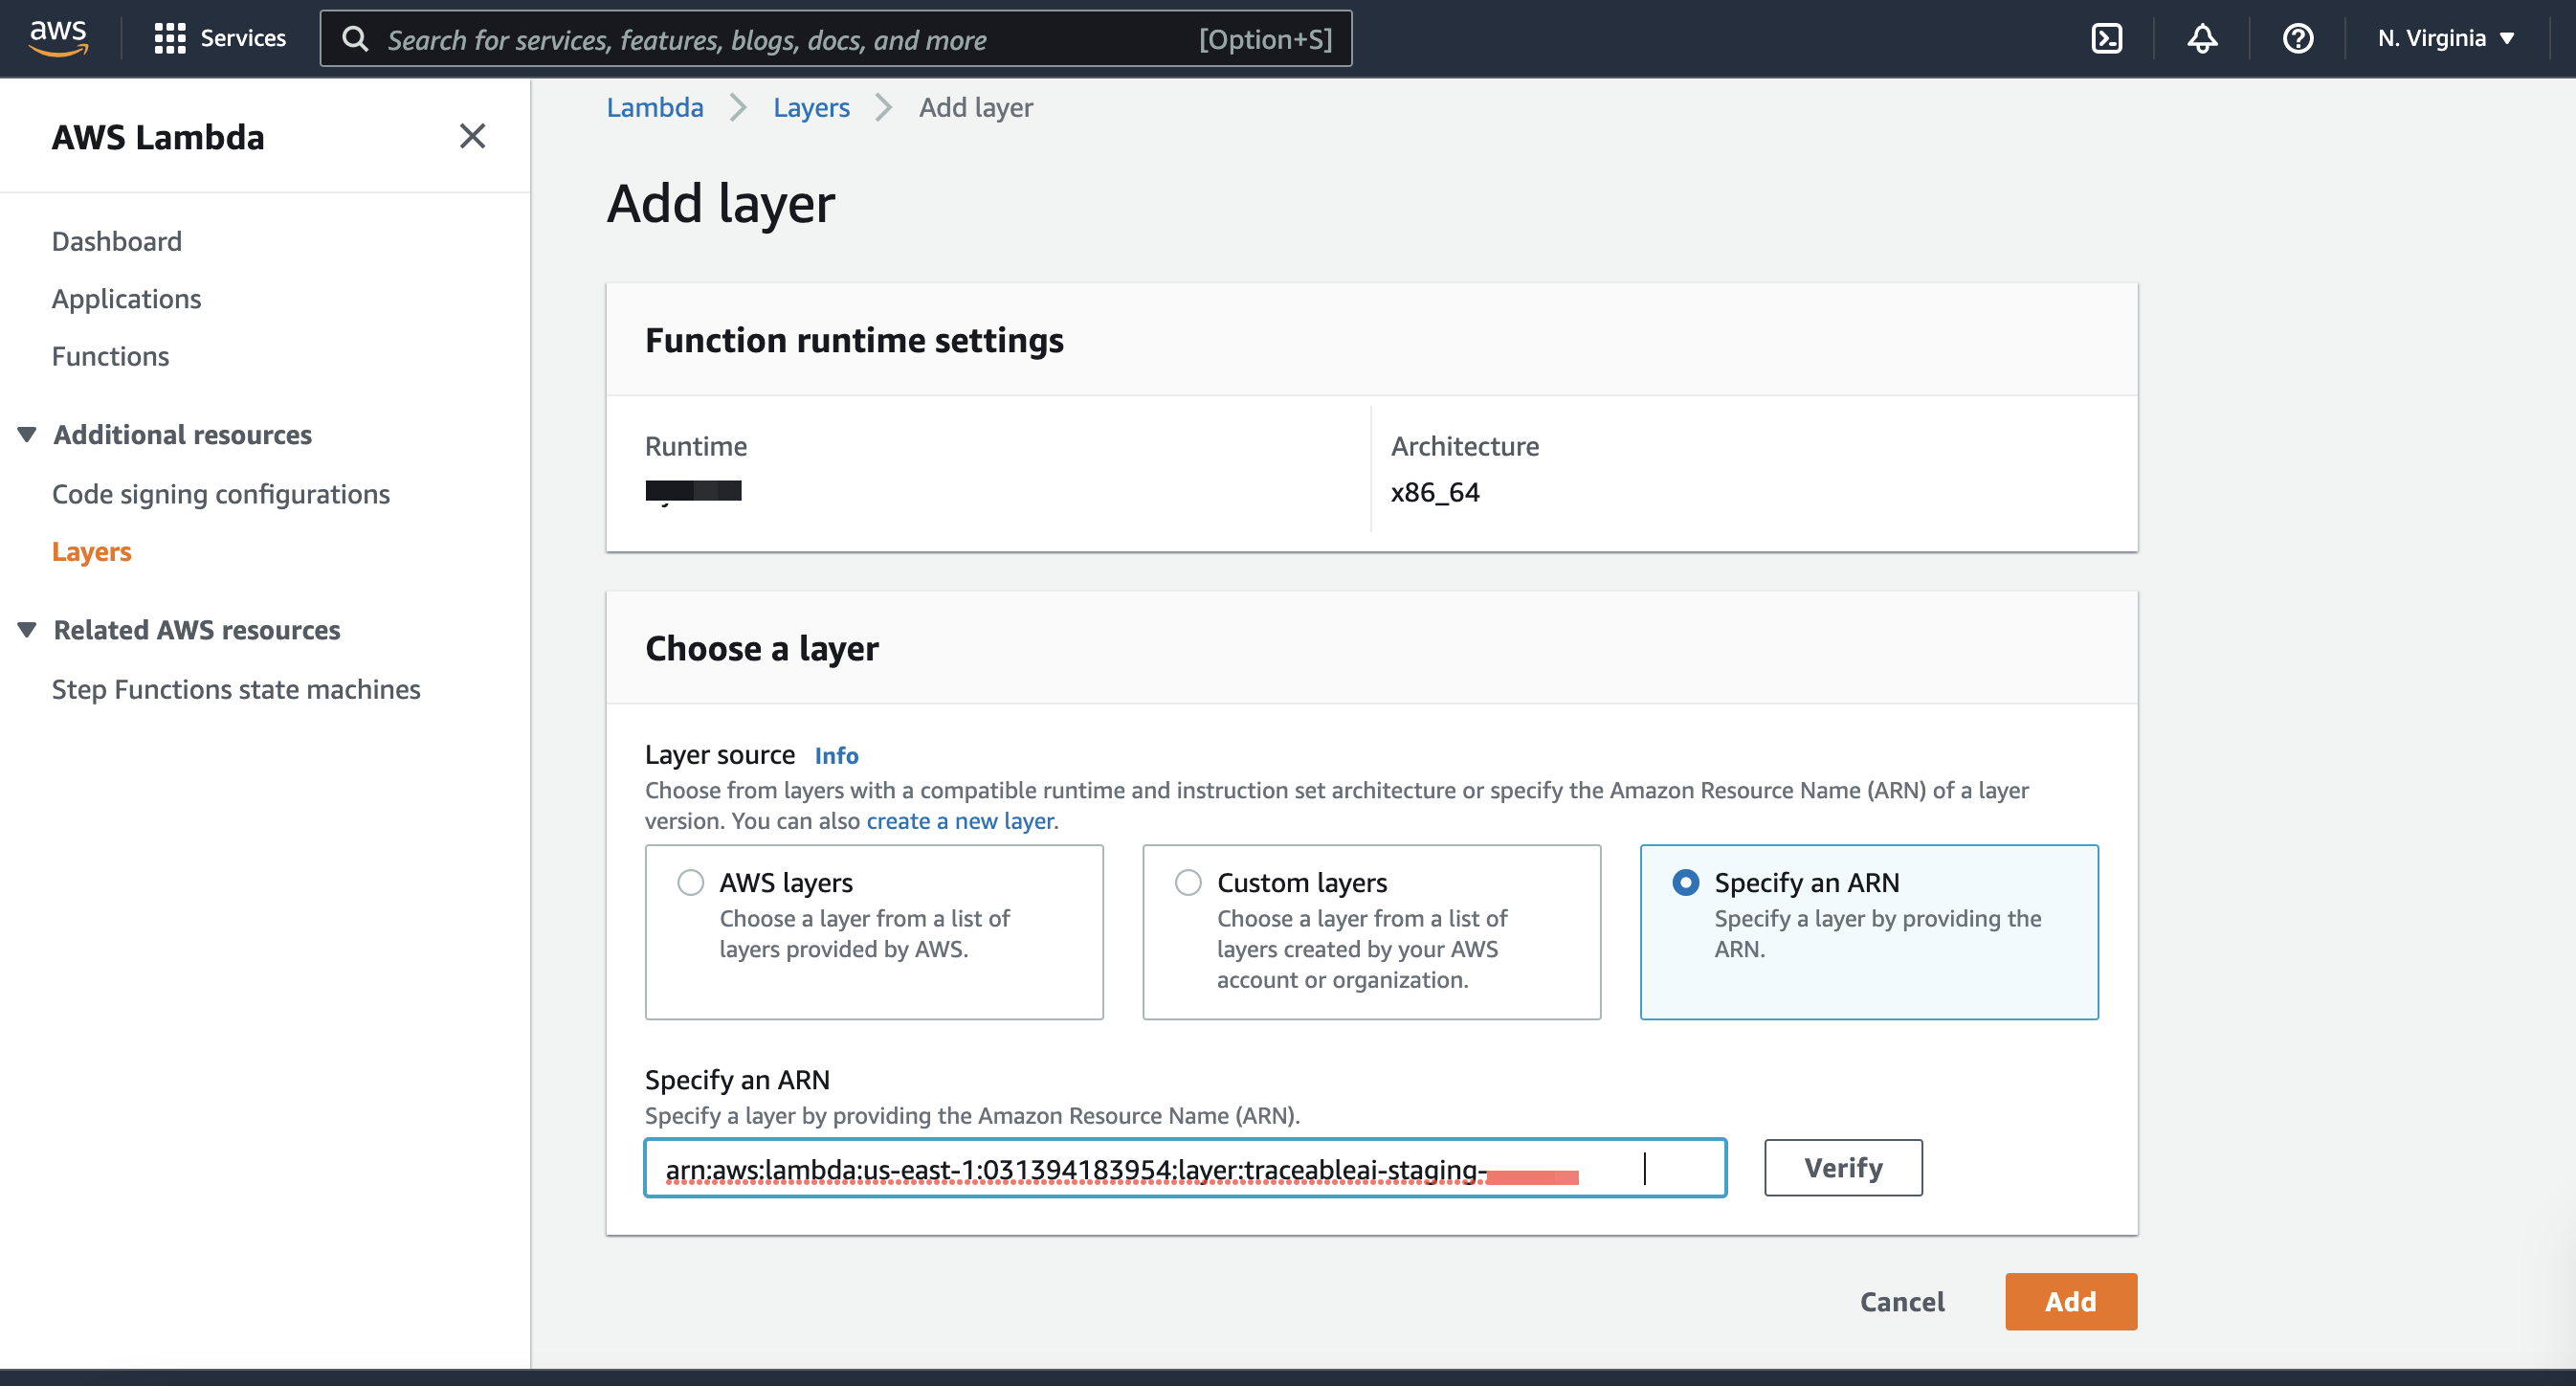
For detailed steps to add a layer, see Add the layers.
In the Specify an ARN section, use the following ARNs:
Node.js ARN – Select the ARN based on the region:
arn:aws:lambda:<aws-region>:031394183954:layer:traceableai-nodejs:16
Collector ARN – Select the ARN based on the region:
arn:aws:lambda:<aws-region>:031394183954:layer:traceableai-collector:6
Replace <aws-region> with the region your lambda is in, for example, us-east-1
Before proceeding to configuring layers, make sure that Lambda has the following:
traceableai-nodejs
traceableai-collector
Step 3 – Configure the layers
As part of configuring layers, you must configure Node.js and Collector layers.
Configure collector layer
To configure the collector layer, configure the Traceable Platform agent endpoint by configuring TPA_ENDPOINT environment variable.
Configure
TPA_ENDPOINT: http://<insert_your_tpa_ip>:4318as an environment variable;tpais the Traceable Platform agent IP address that you noted in the Before you begin section.Make sure that the port number is 4318. It is important to connect to the Traceable Platform agent OTLP HTTP endpoint.
Configure Node.js layer
To configure Node.js layers, set AWS_LAMBDA_EXEC_WRAPPER: /opt/traceableai-instrument environment variable on the lambda. This instructs the lambda to invoke Traceable's wrapper script instead of the default lambda handler. Traceable, in turn, invokes your original handler.
Advanced usage
This is an optional section, but it applies if you are using a Lambda layer that already takes advantage of AWS_LAMBDA_EXEC_WRAPPER. Traceable provides an alternative approach that you can use to inject the Traceable Node.js agent into your environment. Complete the following steps:
Copy your Lambda handler value from the Lambda runtime setting; for example,
index.handler.
Theindex.handlerin Node.js Lambda functions is a way to specify the entry point for your Lambda function, whereindexis the file name (without the.jsextension), andhandleris the function within that file that will be executed when the Lambda function is invoked.Set this value in your Lambda environment variable,
TA_LAMBDA_HANDLER=index.handler.Updated your runtime setting handler to point to a Traceable handler instead:
/opt/nodejs/node_modules/@traceable/nodejsagent/lib/traceable_handler_mjs.handler, or/opt/nodejs/node_modules/@traceable/nodejsagent/lib/traceable_handler_cjs.handler
Note
If you are using ES modules in your Lambda, then you should use the
_mjshandlerIf you are using commonjs for your Lambda, then you should use the
_cjshandler
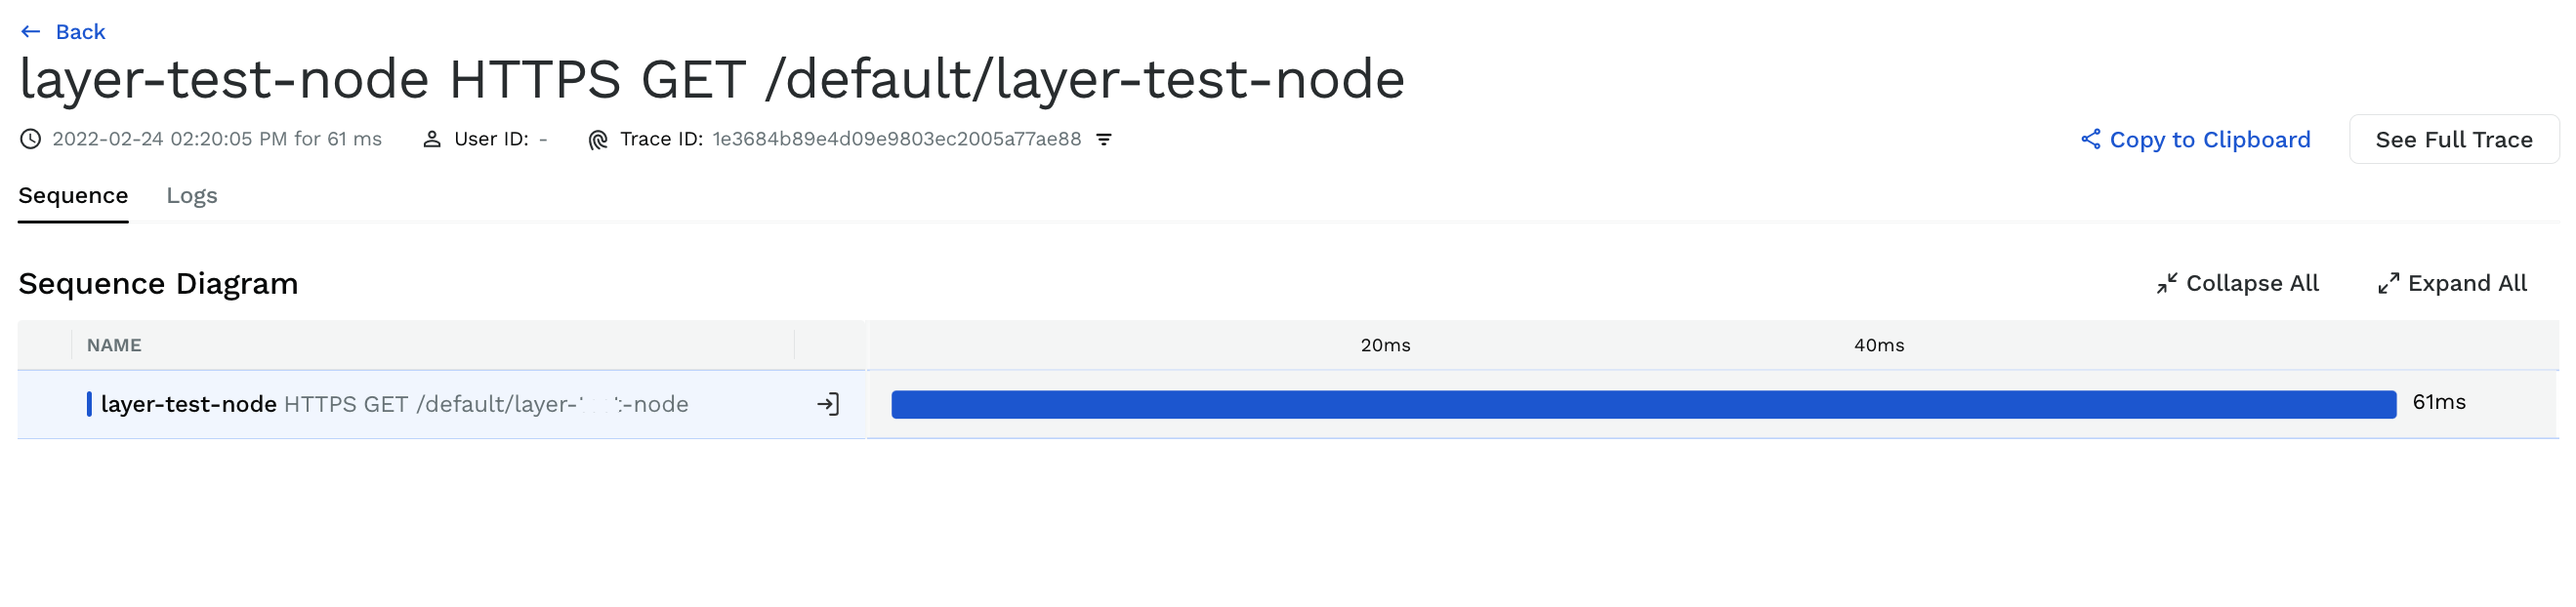
Verification
To verify a successful configuration of Python lambda, invoke the lambda function by sending traffic through the API gateway endpoint. Then, log in to the Traceable platform and check whether the service and associated traces and spans are displayed.
Troubleshooting
Following are a few troubleshooting tips for the node lambda deployment:
Problem | Troubleshooting tip |
|---|---|
No data is reported | Set the |
The response body is not captured. | Check if the lambda returns a “Content-Type” header, that is set to a value including: |
The request body is not captured. | Check if the incoming request is sending a “Content-Type” header, that is set to a value including: |
The status code is not reported. | Check whether the lambda returns a If not, then update the lambda to return a |
Was this article helpful?